 Ši programa skirta tiems, kuriems reikia stebėti savo interneto statistiką. Ji parodo tokius duomenis kaip: PING, HTTP, SMTP, POP3, FTP, etc informaciją.
English
 A network monitor featuring advanced data acquisition and detailed reporting
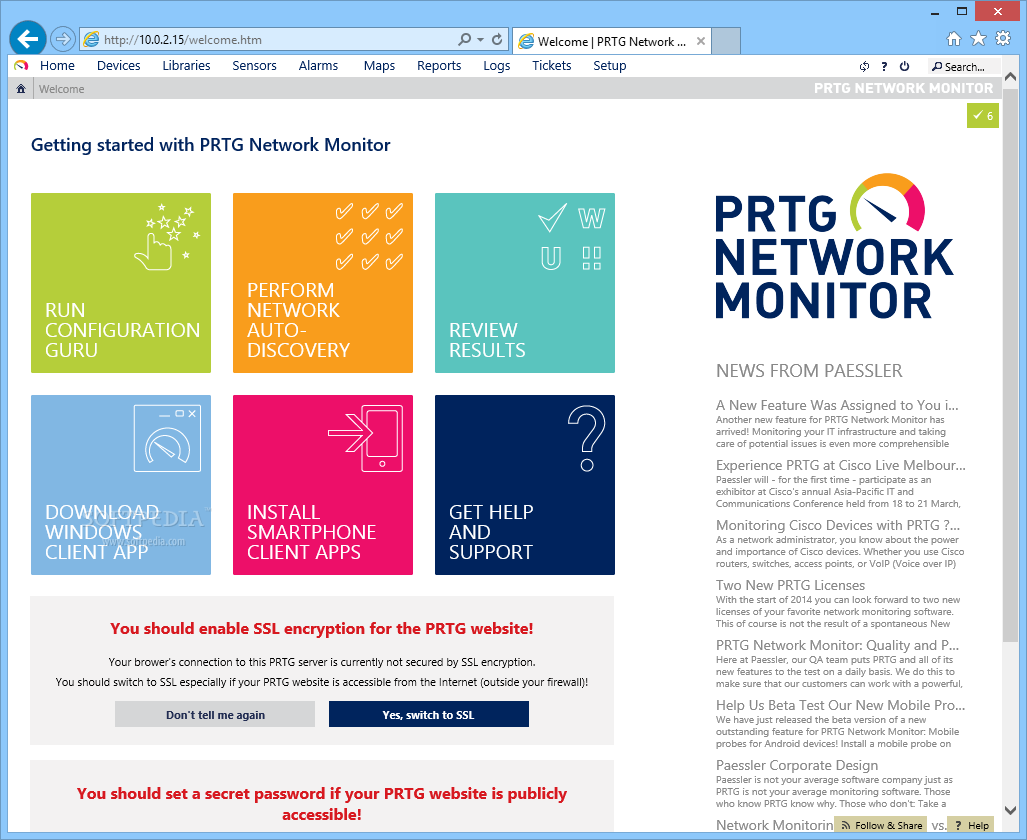
PRTG Network Monitor is a handy and professional network montoring utility. The software’s features include: up/downtime monitoring, traffic and usage monitoring, packet sniffing, in-depth analysis and concise reporting.
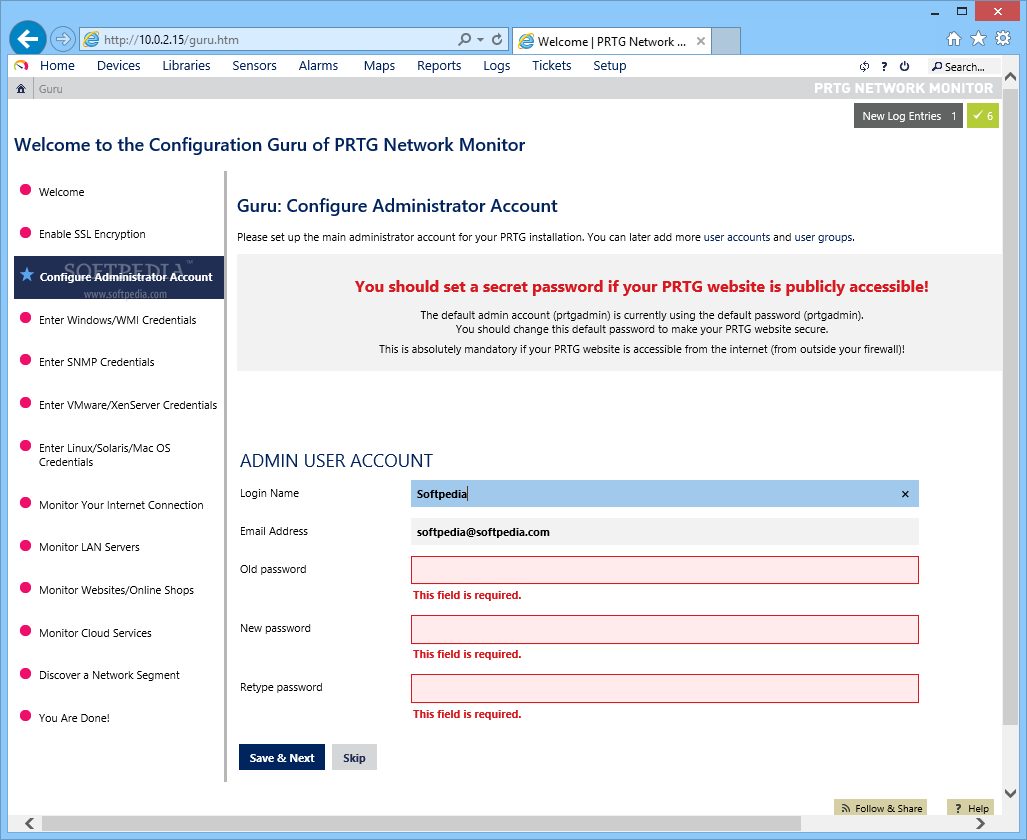
A user-friendly web-based interface allows users to quickly configure the network devices and sensors they wish to monitor. All common methods for network usage data acquisition are supported: SNMP and WMI, Packet Sniffing, and NetFlow.
PRTG Network Monitor includes more than 30 sensor types for all common network services (e.g. PING, HTTP, SMTP, POP3, FTP, etc.), allowing users to monitor networks for speed and failures. As soon as an outage occurs, alerts are sent via email, SMS, pager messages and other means.
Request times and downtimes are recorded in an internal database, making it easy to compile performance, downtime and SLA reports.
Note: The Commercial Editions are required if you want to monitor more than ten sensors for a time interval other than minimum one minute.
Here are some key features of „PRTG Network Monitor“:
Installation & Usability:
· Automatic Network discovery
· Preconfigured device templates with recommended sets of sensors for various devices
· Highly interactive and customizable Interface for optimized usability
· Configuration is arranged in a tree-like hierarchy with inheritance of settings
Architecture & Performance:
· Modern, powerful software engine
· Scales up to several 10,000 sensors for one installation
· Allows load distribution using remote probes for CPU-intense monitoring like e.g. packet sniffing
Network Monitoring Features:
· Bandwidth monitoring using SNMP, NetFlow and Packet Sniffing
· More than 35 sensor types for comprehensive monitoring of small, medium and large networks incl. WMI, PING, HTTP, SNMP, SMTP, POP3, FTP?
· „Smart“ sensors that e.g. automatically discover quad-core CPUs and and monitor them individually as well as the total CPU load
· Various means of alerting and notifications (email, SMS, pager message, HTTP request, syslog, etc.)
· For more and detailed features please check our knowledge base
User Interface:
· The integrated Webserver supports SSL security, multiple logins, user groups and an HTTP-based API for interfacing with other applications
· Monitoring results are viewable in various perspectives
· User can create „Maps“ which bring together monitoring status, graphs and tables in customizable layouts and with customizable backgrounds like network charts
Requirements:
· 64 MB RAM (128 MB and more recommended)
· 20 MB disk space for installation
· between 25kb and 300kb disk space per sensor per day for the monitoring data database
· TCP/IP Network Connection
What’s New in This Release:
· Bugfix: [Sensors] Fixed a memory/handle leak in http sensors


